

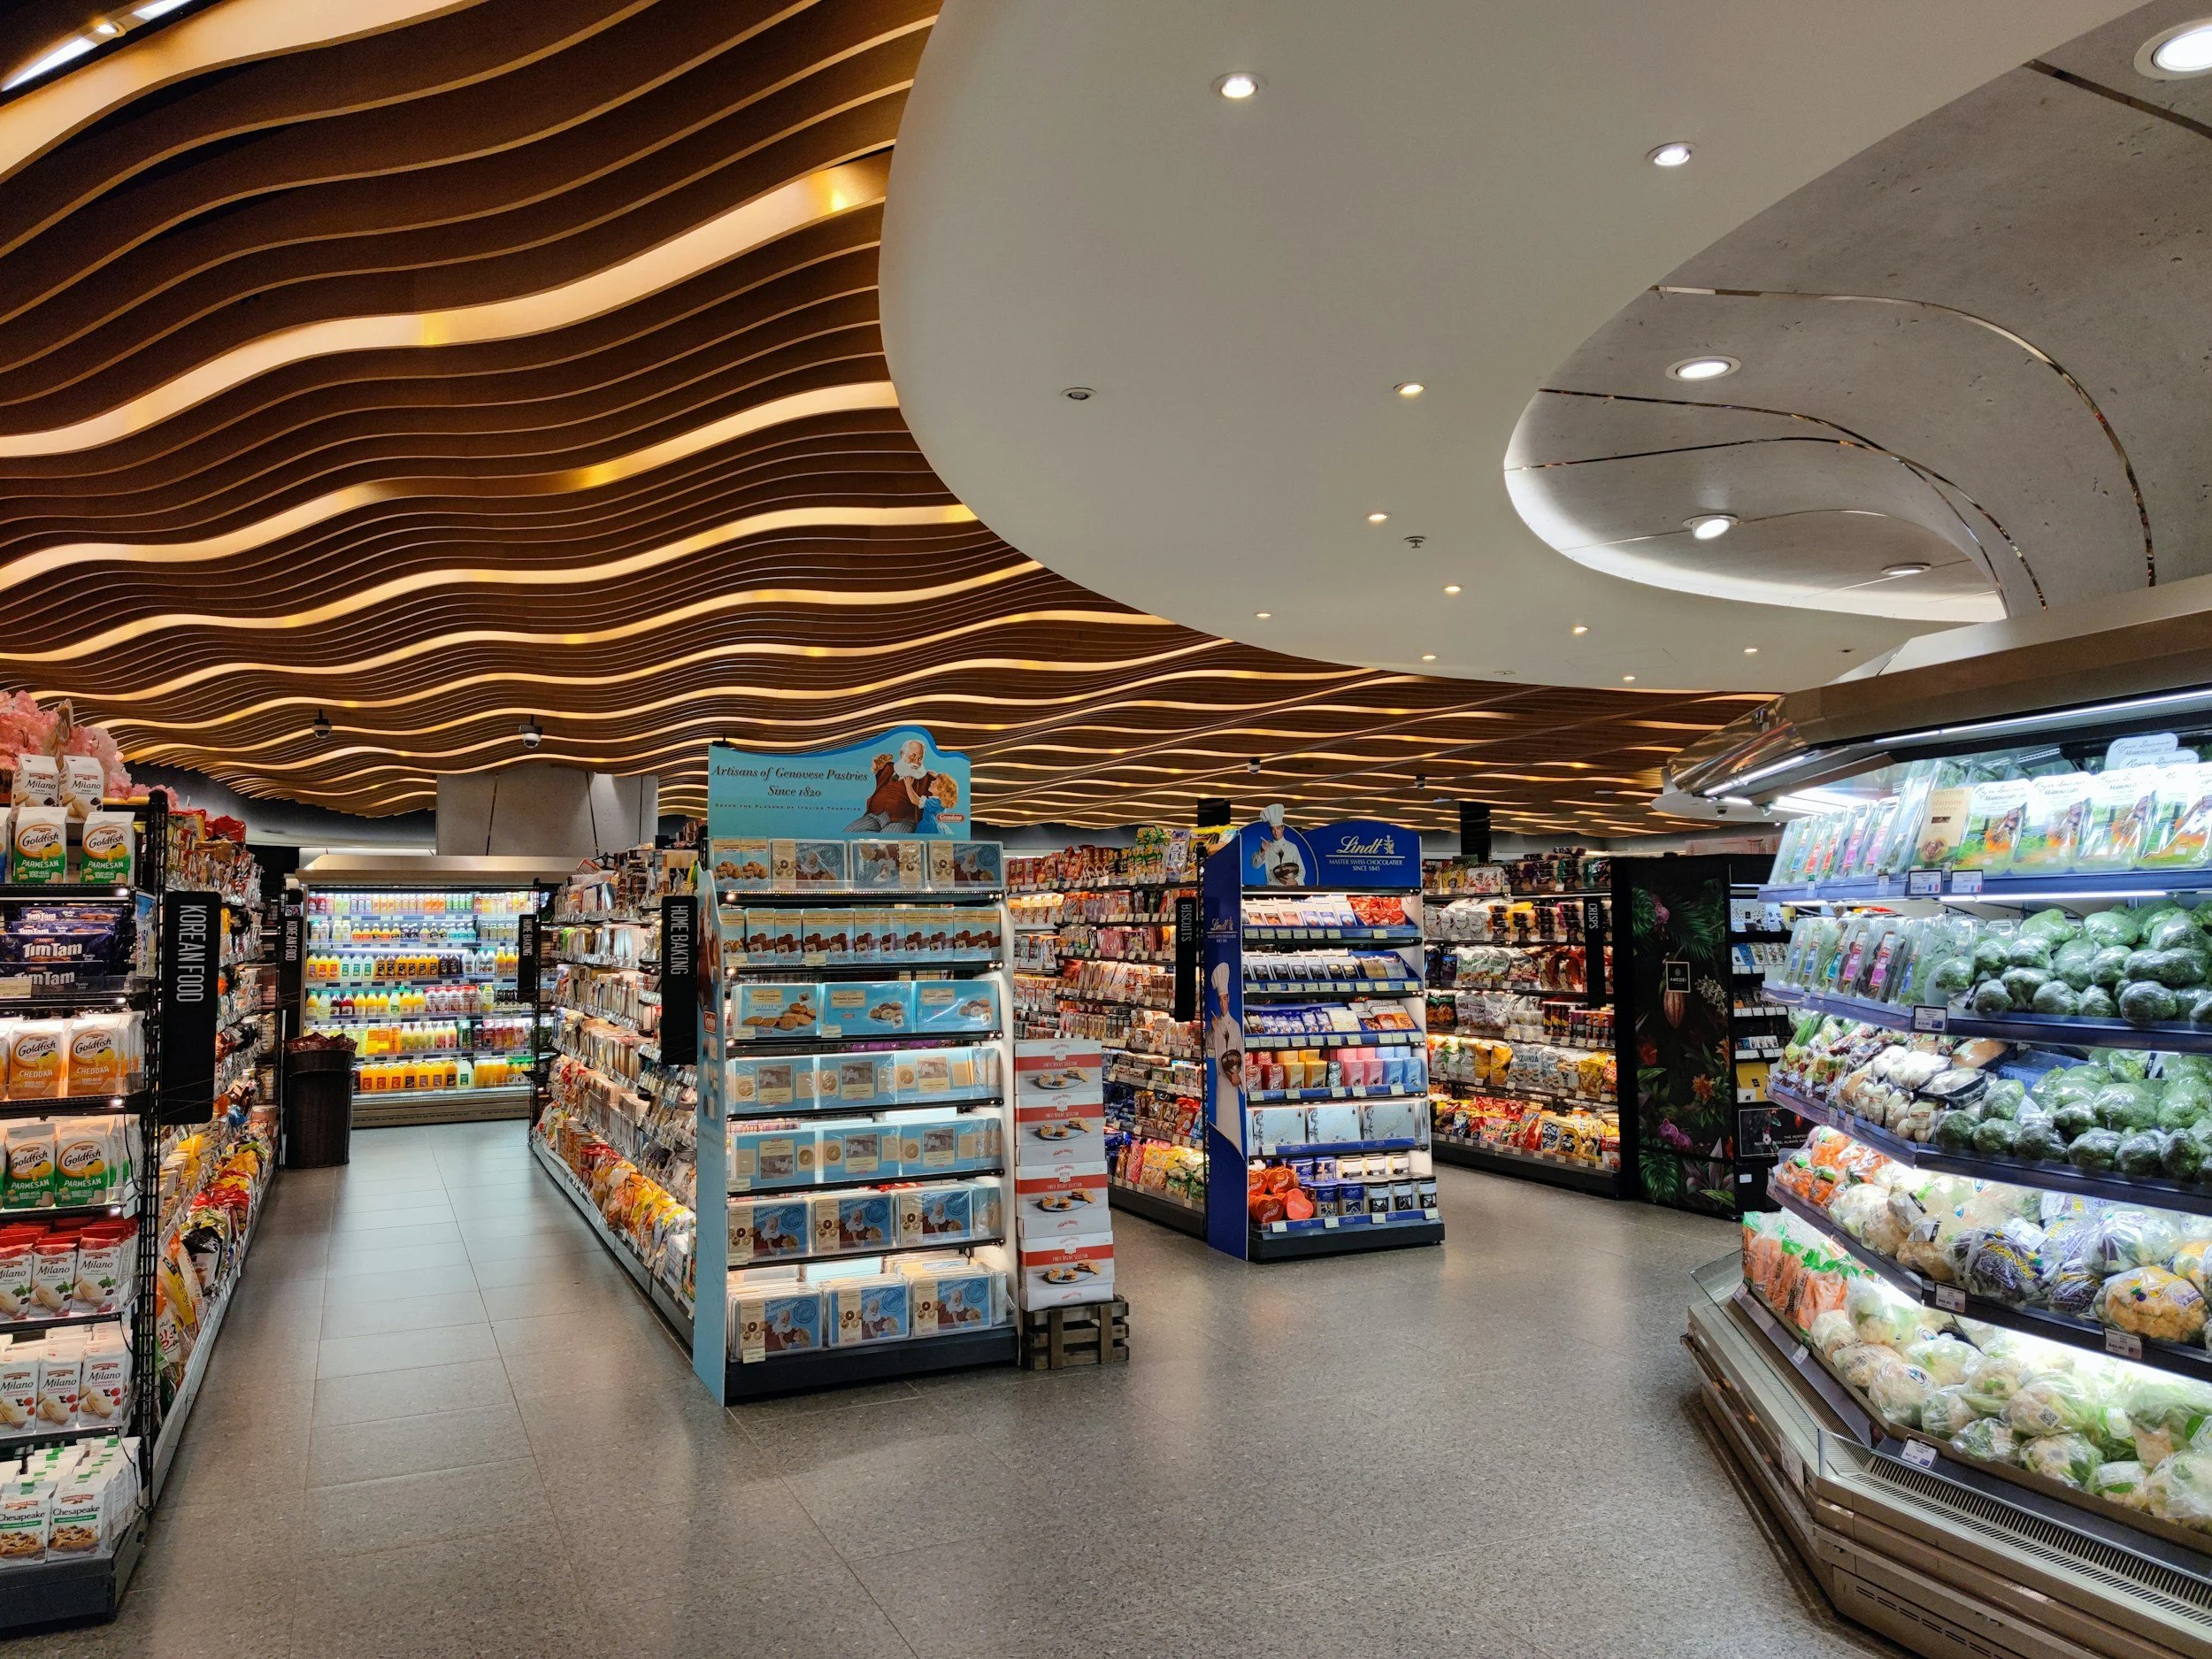
Supermarkets & Grocery
The answers to your tightest margins are already in your data.
Every supermarket collects the numbers that could fix its biggest problems: what sold, what spoiled, what got ordered, what got marked down. Almost nobody reads them at the depth where the answers live. We do.
The problems you're living with
Spoilage and shrink
Somebody in your store writes it down every time a case of mangoes goes in the dumpster. The write-off exists to prove it wasn't theft, and then it disappears into a file nobody models.
Across every store, every department, every week, those write-offs are a pattern: which items die, where, in what season, at what order quantity. A person can't see that pattern across 40 stores and 52 weeks. Our models can. Less of what dies. More of what sells through.
Ordering, Pricing, and the supply chain
The order sheet is a prediction, whether or not anyone calls it that. Most stores predict with last week's number and a gut feel, then pay for the miss on both sides: empty shelf or full dumpster.
We build demand models at the item, store, and week level, from data you already have. The order stops being a guess.
Promotional waves
Promotions make demand move in waves: the sale, the load-up before it, the trough after. Doug watched this from inside the consumer packaged goods world, where wholesalers timed their buying to a candy maker's six-week sale cycle and caught the price at the bottom every time.
The wave is visible in your data before it arrives. See it coming and you buy at the right moment, staff for the peak, and stop marking down what the wave was always going to carry out the door.
Why we can do this
Doug Newell's first job in analytics was predicting demand for supermarket-shelf products. At Peter Paul Cadbury he found handwritten sales journals going back to 1945 and built models that predicted seasonal candy sales within 1%. That was the start of a career spanning 50 to 100 Fortune 500 clients, from American Express to AARP, where his targeting models saved $8 million a year.
Today that pattern-finding runs at machine scale. Swarmalytics models work through 16,000+ variables and surface the 15 to 30 that actually drive an outcome.
Whether the outcome is catastrophic insurance losses or pounds of ground beef sold on a Tuesday, the discipline is the same: many possibilities, one right answer, found early.
We are data junkies. There is no data we don't like, including the messy, half-manual files where supermarket answers usually hide.
How It Works
Bring us one problem & one store's worth of data
Sales, write-offs, orders, promo calendars. Whatever you already keep, in whatever shape it's in.
We model it
Item level, store level, week level. You'll see what the data says about the problem you brought us.
You make different calls
Order sheets, promo timing, markdown decisions, staffing. Decisions with a prediction behind them instead of a gut feel.
The first pass tells you whether this works for your operation, in weeks. You risk a conversation.
The margins are thin. The data isn't.
Bring us the problem that bugs you the most. We'll show you what your own numbers already know about it.